
Top 3 Essential PC Game Metrics Trackers: My Top Tool Picks for Gamers
Top 3 Essential PC Game Metrics Trackers: My Top Tool Picks for Gamers
Quick Links
Key Takeaways
- NVIDIA Statistics Overlay is user-friendly and a great solution for NVIDIA GPU owners; it offers a lot of latency-related metrics but lacks some important stats, like a frame-time graph.
- RivaTuner Statistics Server has a comprehensive suite of performance metrics, but it requires third-party software such as MSI Afterburner and HWiNFO64 to pull performance data from.
- Intel PresentMon offers GPU and CPU busy metrics to identify system bottlenecks and is an excellent, vendor-agnostic all-in-one solution that doesn’t require additional software to work.
If you want to monitor your in-game performance stats but don’t know which tool to use, fret not. Here are three in-game performance monitoring apps I wholeheartedly recommend to every PC gamer, regardless of which hardware you’re using.
NVIDIA Statistics Overlay
The NVIDIA Statistics Overlay is part of GeForce Experience and the new NVIDIA app , meaning you probably already have access to it if you own an NVIDIA graphics card. I like this one because it’s fairly simple to set up and use. While it lacks some important performance monitoring stats, such as a frame-time graph, it’s a solid choice for PC gamers who just want the basics. Perhaps the biggest disadvantage of this tool is that, naturally, it isn’t available to owners of AMD GPUs.
The NVIDIA Statistics Overlay includes an impressive suite of latency-related performance stats that include render latency (the time needed for your graphics card to fully render a single frame), mouse latency, combined PC and display latency (the time from when your OS registers your mouse click to when a frame is rendered of your monitor), and total system latency.
Setting up the overlay is pretty straightforward. Note that the following guide is for the NVIDIA app , but the procedure is quite similar if you’ve got GeForce Experience installed on your PC instead.
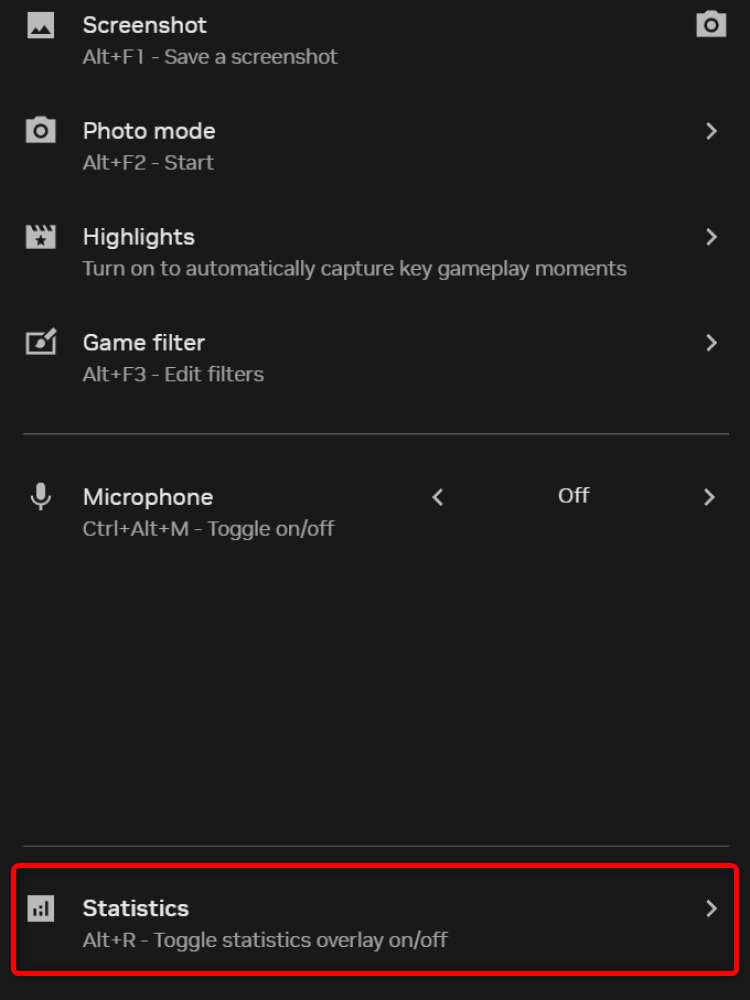
You can pull up the overlay when in-game by pressing Alt+R while GeForce Experience or the NVIDIA app runs in the background. To set up and tweak the overlay, press Alt+Z to open the NVIDIA overlay and then select the “Statistics” tab located at the bottom of the NVIDIA in-game overlay.
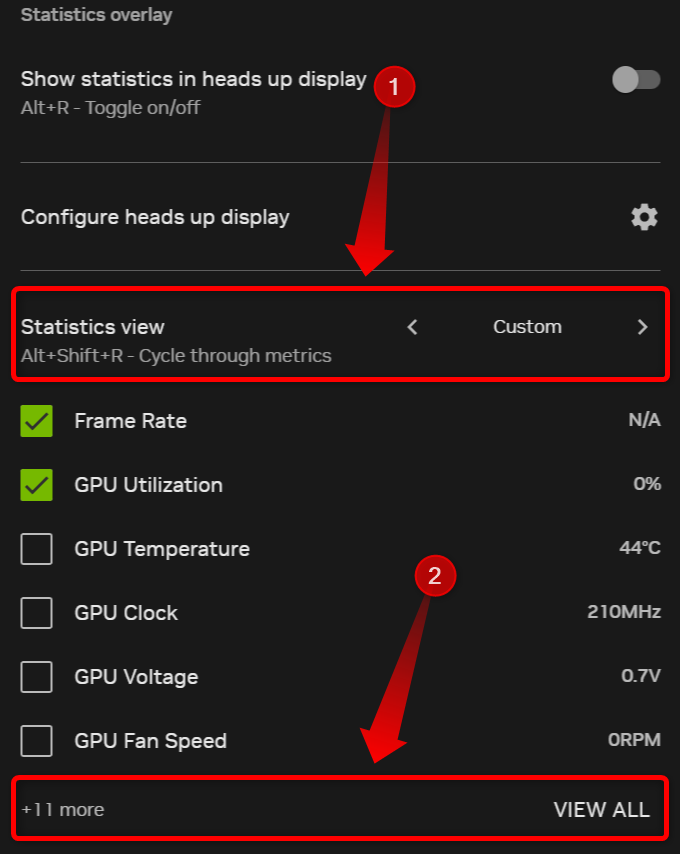
Once there, make sure to select the “Custom” statistics view, click on the “View All” button, and then simply enable the performance metrics you want to see on the statistics overlay.
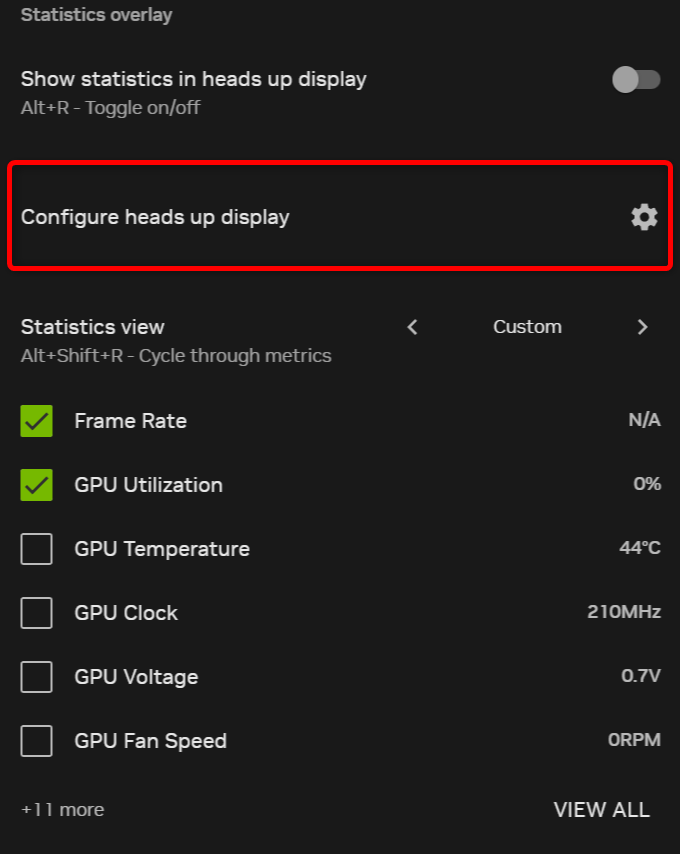
You can also configure the heads-up display by clicking the “Configure Heads Up Display” button in the “Statistics” options menu.
 RivaTuner Statistics Server
 RivaTuner Statistics Server
The legendary RivaTuner Statistics Server , also known as RTSS, is the oldest in-game performance monitoring tool on this list. I’ve been using RTSS for more than a decade, and in that time, I’ve had zero issues with it.
I like it because it has an impressive suite of performance metrics you can monitor and because it’s fairly simple to use after you learn how to configure it. On the other hand, RTSS requires a third-party app to pull the performance data from. Since RTSS is bundled with MSI Afterburner , I recommend using that combo because MSI Afterburner can provide most of the GPU and CPU-related stats you’d want to monitor.
But if you want to also monitor advanced CPU stats such as per-core clocks, RAM sticks, and SSD thermals or include other exotic stats such as your motherboard chipset thermals, voltage of different PSU rails, and much more, you’ll need to install and configure HWiNFO64 .
I recommend downloading and installing the MSI Afterburner and RTSS combo . Download and configure HWiNFO only if you want access to advanced stats not found in MSI Afterburner.
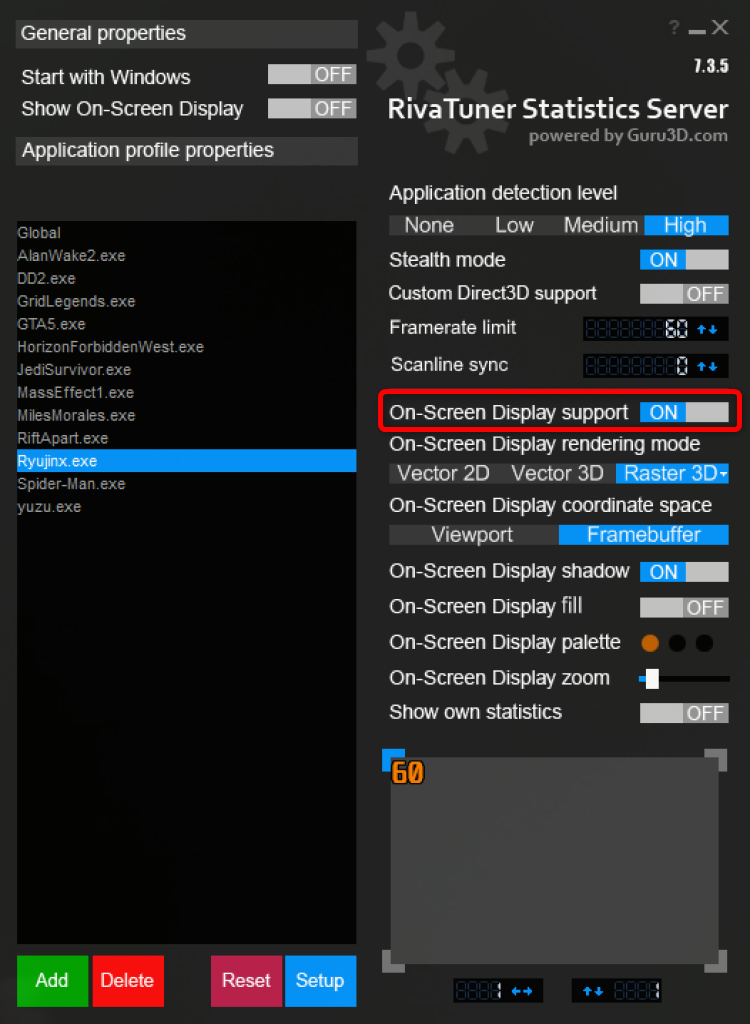
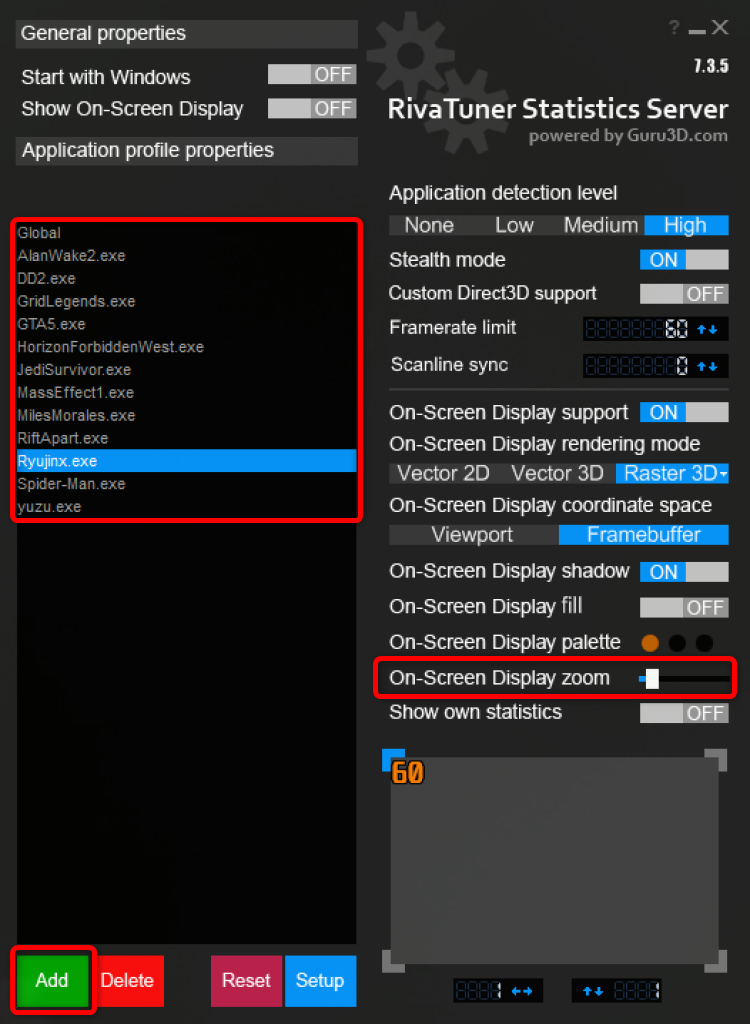
After you download and install both apps, open RTSS, which you can find in the taskbar notification area. You might have to click the “Show Hidden Icons” button to access the RTSS and MSI Afterburner icons. Once you open RTSS, set the “On Screen Display Support” to ON.
Don’t forget that you can add game EXE files to RTSS and create custom RTSS profiles. For example, if a game uses anti-cheat that can block RTSS, I recommend creating a custom profile and disabling the on-screen display (OSD) only in that game. You can also tweak a couple more OSD-related options in RTSS, such as the OSD zoom level.
You can also use RTSS as an in-game frame limiter, which I recommend because I’ve found it works much better than frame limiters available in games or those available in NVIDIA and AMD apps.
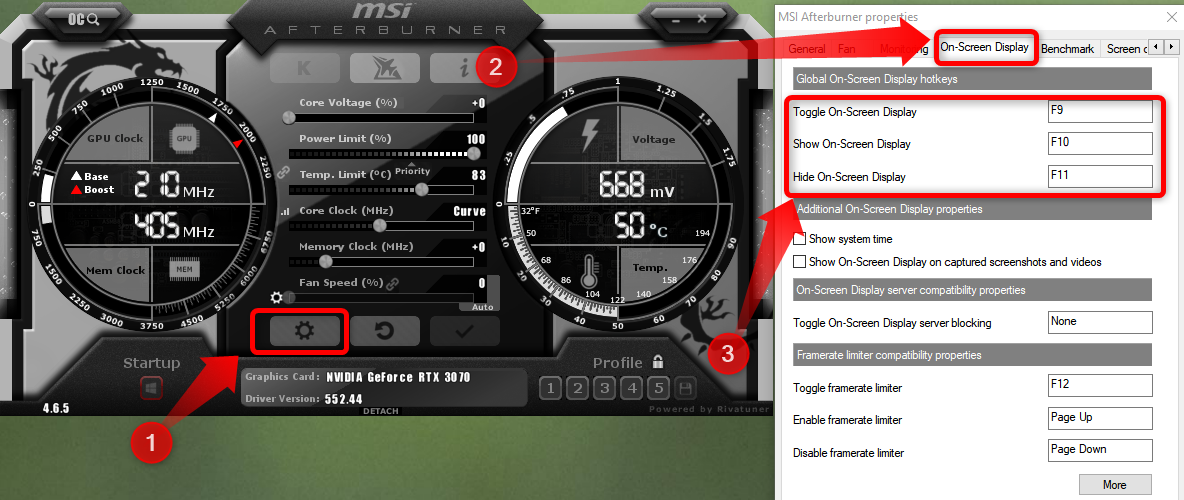
Once you finish setting up RTSS-related options, open MSI Afterburner, locate the settings icon, and click it. Once you’re in the options menu, locate the “On-Screen Display” tab and assign the keys to show and hide the on-screen display, as shown below. You can also assign a key to toggle the OSD, but in my case, the OSD toggle doesn’t work no matter which key I assign.
Now, click the “Monitoring” tab. In this tab, you can pick any in-game performance metric you want to see on the OSD; to enable it, click the “Show in On-Screen Display” box. You can also rename every metric by clicking the “Override Graph Name” and “Override Group Name” buttons.
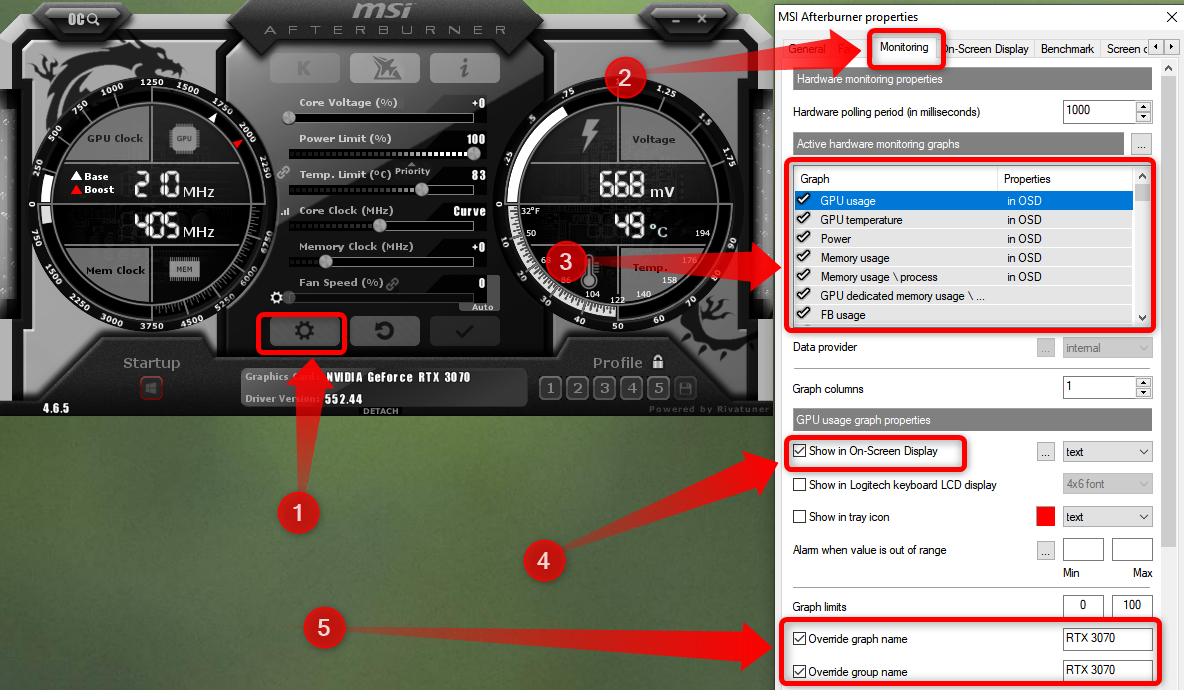
After you enable the performance stats you want to see on the OSD, click the “Apply” button, and try out the OSD by entering the game and pressing the button you’ve mapped to open the RTSS performance overlay.
Intel PresentMon
The third and last entry on this list is Intel PresentMon . I’ve been using PresentMon for a few months and can say that it works great and offers enough performance monitoring metrics for most PC gamers, including advanced users. Compared to RTSS, PresentMon may be a better solution because it doesn’t require third-party software to pull performance metrics from.
While RTSS is still my favorite, I recommend PresentMon to all PC gamers looking for an all-in-one solution that doesn’t require additional software, as well as to NVIDIA GPU owners who find the NVIDIA statistics overlay lacking.
While PresentMon trumps both NVIDIA statistics overlay and RTSS in multiple aspects, its main advantage over the other two in-game performance monitoring tools featured on this list is the fact it supports GPU and CPU busy metrics, which are quite handy when trying to identify your system’s main bottleneck .
In a nutshell, these stats show you the percentage of time when your GPU or CPU is busy. For GPU-bound workloads, such as video games, you want your GPU to be busy 100% of the time since that means your GPU doesn’t sit idle waiting on data from your CPU. Watch the in-depth explanation video below by Gamers Nexus for more on GPU and CPU busy metrics.
Setting up Intel PresentMon is fairly straightforward. First, download and install the software.
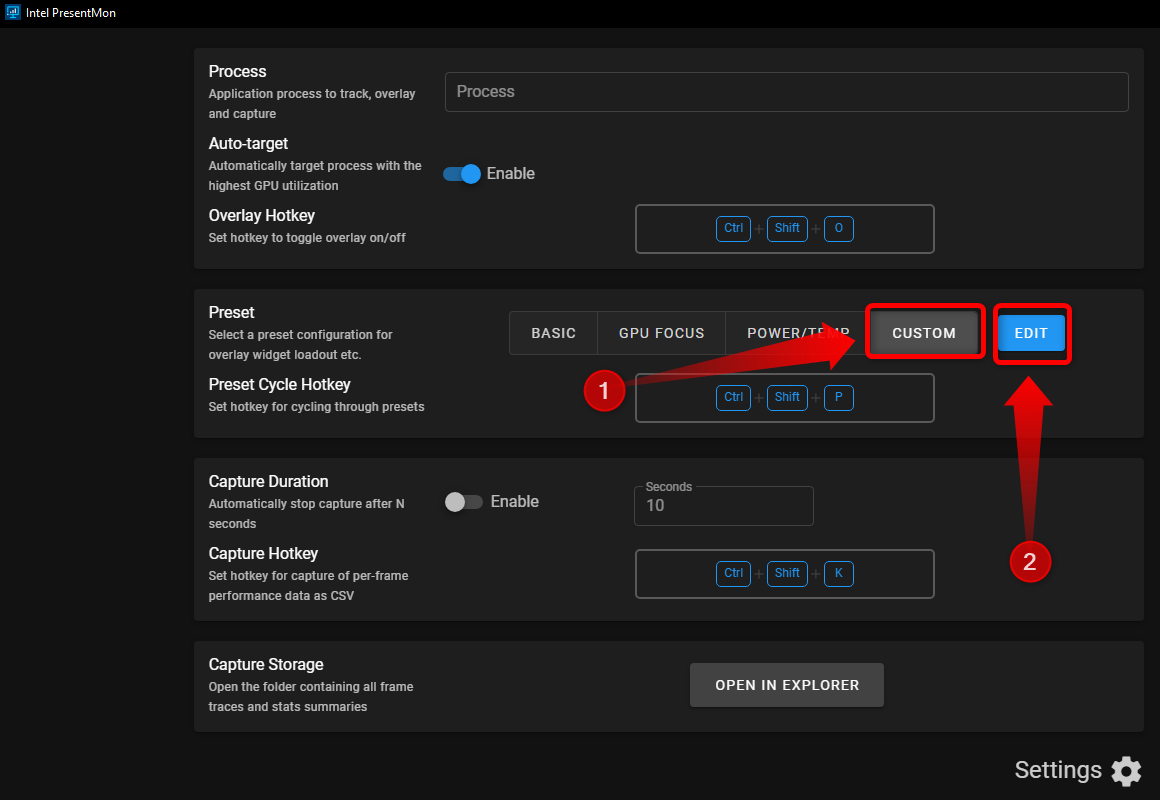
Next, open the app. From there, you can either pick one of the monitoring presets or create a custom one. You can also customize general settings, such as the position and size of the overlay, by clicking the “Settings” button.
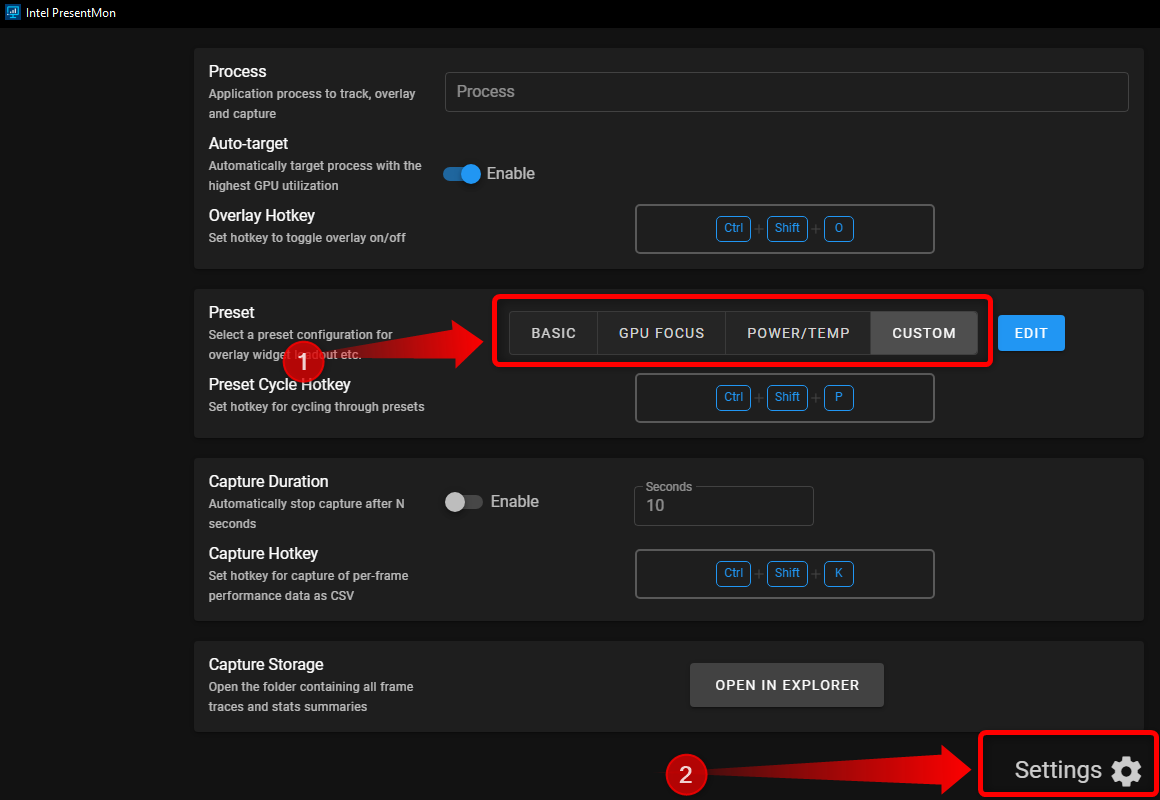
When you select the custom preset, click the “Edit” button to customize it.
Once in the configuration menu, explore different options and create your perfect monitoring overlay.
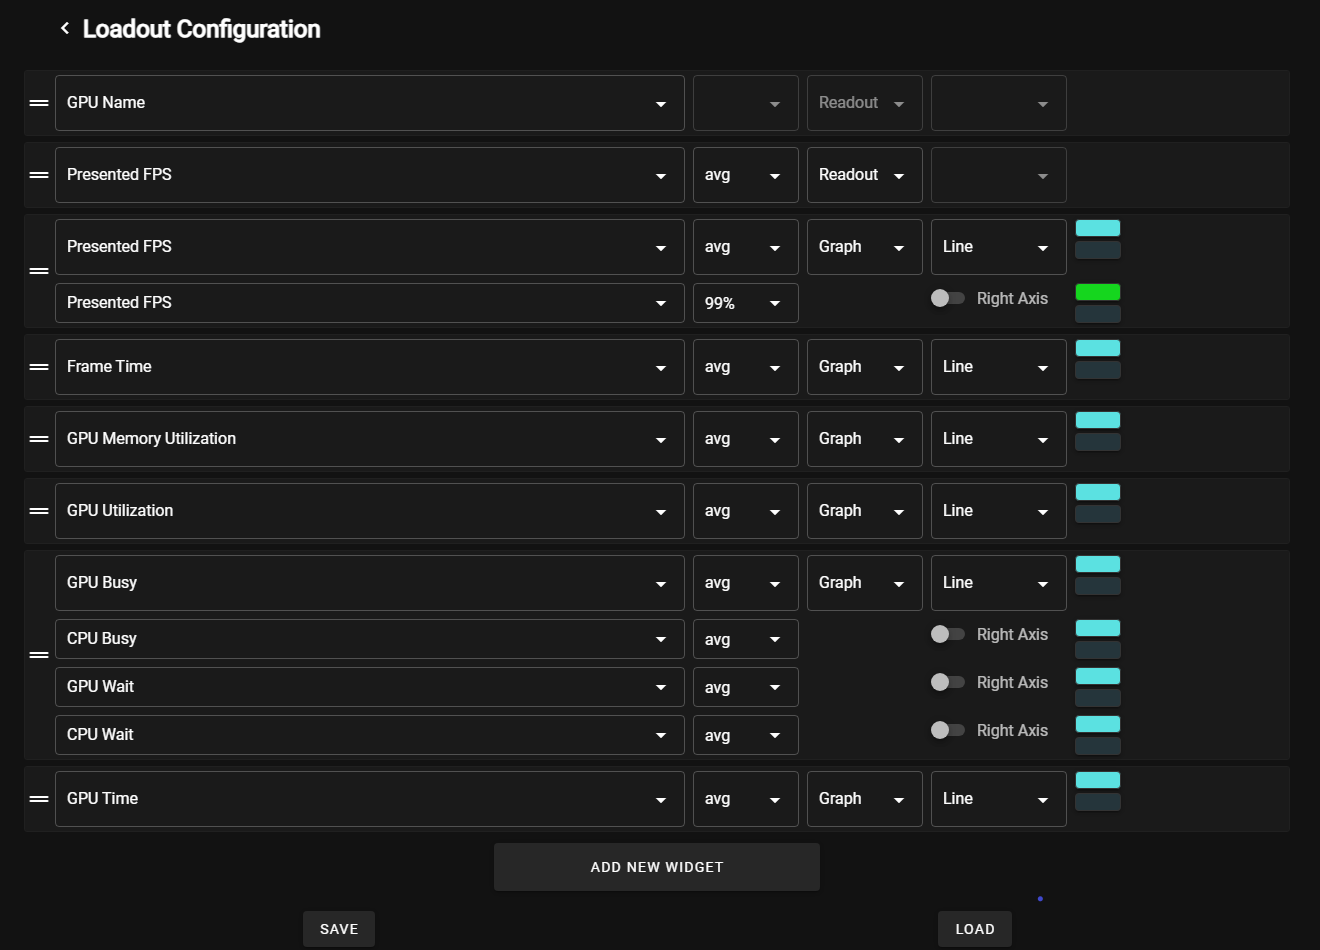
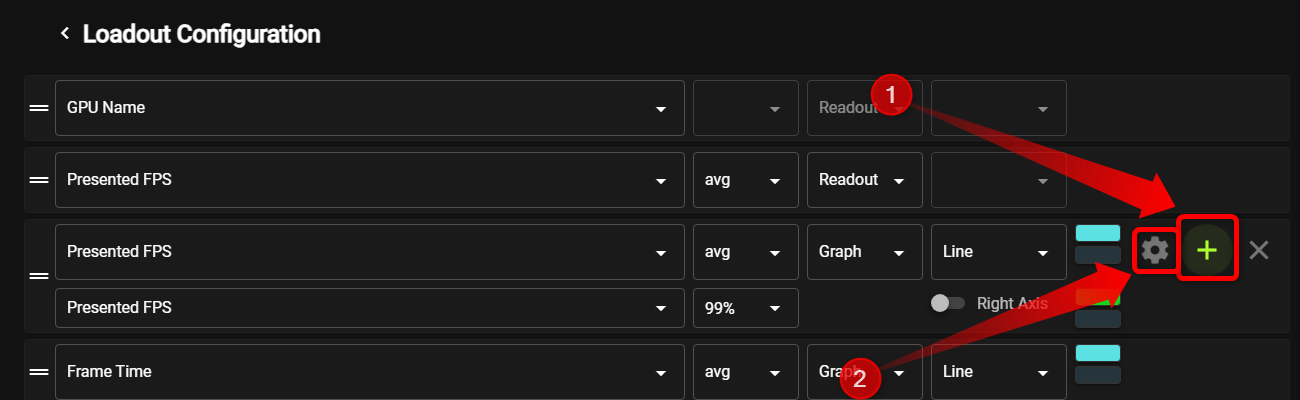
You can combine multiple metrics by pressing the “Plus” button. For example, you can combine GPU and CPU busy graphs with GPU and CPU wait graphs, average and 99% low FPS, CPU and GPU utilization, and more. The “Options” button next to the “Plus” button allows you to customize each graph.
Don’t forget that you can show most data as readouts—numbers, in other words—or graphs.
I hope this guide has helped you find your next in-game performance monitoring tool. Want to learn more about in-game performance metrics and which stats you should focus on? Learn which in-game performance stats I personally monitor and why .
Also read:
- [New] Engage, Inspire, Convert Strategizing for Impactful InstaVideo Content for 2024
- [Updated] 2024 Approved SRT to SUB Shift Expert Strategies & Actions
- ChatGPT-Inspired Infographics and Data Tables
- Decoding Grok by Elon Musk: An Insight Into This Innovative AI & Its Affordability
- Elite Gameplay in Simulated Fluids & Flows
- Exclusive Testing Results: The Premier Lineup of Tablets Detailed Reviewed | ZDNet Insights
- Exploring the Superiority: 6 Reasons to Opt for the ChatGPT iOS Version
- In 2024, Here are Some of the Best Pokemon Discord Servers to Join On Nokia C02 | Dr.fone
- In 2024, The Logic of iMovie's Trim Feature
- Legal Recognition
- Rewind Movies The Android Guide
- The Controversy Surrounding GPT's Role in Hacking Tools
- The Demise of ChatGPT Crack Techniques: Insights Into 7 Reason for Their Discontinuation
- Top AI Programmers Unleashed: Can ChatGPT Outperform Gemini for Developers?
- Unlock Your Device iCloud DNS Bypass Explained and Tested, Plus Easy Alternatives From iPhone 8 Plus
- Unlocking More Power in ChatGPT: A Guide to the 5 Most Underutilized Features
- Unveiling the Future of Reading: Top 5 Artificial Intelligence Platforms to Find Books You'll Love
- Title: Top 3 Essential PC Game Metrics Trackers: My Top Tool Picks for Gamers
- Author: Jeffrey
- Created at : 2024-11-15 02:37:06
- Updated at : 2024-11-18 18:20:38
- Link: https://tech-haven.techidaily.com/top-3-essential-pc-game-metrics-trackers-my-top-tool-picks-for-gamers/
- License: This work is licensed under CC BY-NC-SA 4.0.